Michael Friis' Blog

About


Wikileaks Iraq wardiaries data quality

til;dr: The Wikileaks Iraq data is heavily redacted (by Wikeleaks presumably) compared to the Afghanistan data: Names — of persons, bases, units and more — have been purged from the “Title” and “Summary” column-texts and the precision of geograpical coordinates have been truncated. This makes both researching and visualizing the Iraq data somewhat difficult.

(this is a cross-post from the Ekstra Bladet Bits blog)

Ekstra Bladet received the Iraq data from Wikileaks some time before the Friday 22. 23:00 (DK-time) embargo. We knew the dump was going to be in the exact same format as the Afghanistan one, so loading the data was a snap. When we started running some of the same research-scripts used on the Afghanistan data, it quickly became clear that something was amiss however. For example, we could only find a single report mentioning Danish involvement (namely the “Danish Demining Group”) in the Iraq War. We had drawn up a list persons, companies and places of interest, but searches for these also turned up nothing. A quick perusal of a few sample reports revealed that almost all identifying names have been purged from report texts.

Update: It turns out that Ekstra Bladet got the redacted version of the from Wikileaks. Apparently some 6 international news organisations (and the Danish newspaper Infomation) got the full, unredacted data. They won’t be limited in the ways mentioned below.

This caused us to temporarily abandon the search for interesting individual events and instead try to visualize the events in aggregate using maps. I had readied a heatmap tile-renderer which — when fed the Afghanistan data — produces really nice zoomable heatmaps overlayed on Google Maps. When loaded with the Iraq data however, the heatmap tiles had strange artifacts. This turns out to be because the report geo-coordinate-precision has been truncated. We chose not to publish the heatmap, but the effect is also evident on this Google Fusion-tables based map of IED-attacks (article text in Danish). The geo-precision truncation makes it impossible to produce something like the Guardian IED heatmap, demonstrating IED-attacks hugging roads and major cities.
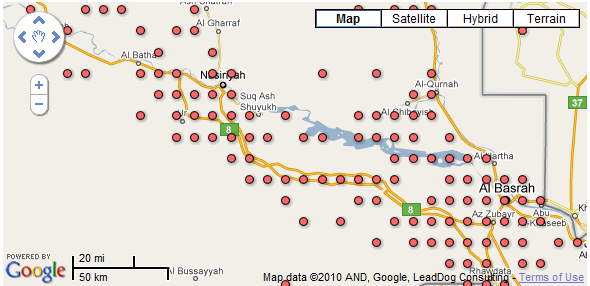
Artifacts due to geo-precision blurring

We did manage to produce some body count-based articled before the embargo. Creating simple infographics showing report- and attack-frequency over time is also possible. Looking at the reports, it is also fairly easy to establish that Iraqi police mistreated prisoners. Danish soldiers are known to have handed over prisoners to Iraqi police (via British troops), making this significant in a Danish context. We have — however — not been able to use the reports to scrutinize the Danish involvement in the Iraq war in the same depth that we could with the Afghanistan data.

We initially thought the redactions were only for the pre-embargo data dump and that an unredacted dataset might become available post-embargo. That seems not to be the case though, since the reports Wikileaks published online after the embargo are also redacted.

I’m not qualified to say whether the redactions in the Iraq reports are necessary to protect the individuals mentioned in them. It is worth noting that the Pentagon itself found that no sources were revealed by the Afghanistan leak. The Iraq-leak is great ressource for documenting the brutality of the war there, but the redactions do make it difficult to make sense of individual events.

C# and Google Geocoding Web Service v3

Need to geocode addresses using the v3 Google Geocoding Web Service? There are some good reasons to choose the new v3 edition — most importantly, you don’t need an API key. You could use geocoding.net which — at the time of writing —  has some support for v3. I decided to hack up my own wrapper though, and using Windows Communication Foundation, it turned out to be really simple! Note that if you need more of the attributes returned by the Web Service, you should add them to the DataContract classes.

using System;
using System.Runtime.Serialization;
using System.Runtime.Serialization.Json;
using System.Net;
using System.Web;

.
.
.

private static GeoResponse CallGeoWS(string address)
{
	string url = string.Format(
		"http://maps.google.com/maps/api/geocode/json?address={0}&region=dk&sensor=false",
		HttpUtility.UrlEncode(address)
		);
	var request = (HttpWebRequest)HttpWebRequest.Create(url);
	request.Headers.Add(HttpRequestHeader.AcceptEncoding, "gzip,deflate");
	request.AutomaticDecompression = DecompressionMethods.GZip | DecompressionMethods.Deflate;
	DataContractJsonSerializer serializer = new DataContractJsonSerializer(typeof(GeoResponse));
	var res = (GeoResponse)serializer.ReadObject(request.GetResponse().GetResponseStream());
	return res;
}

[DataContract]
class GeoResponse
{
	[DataMember(Name="status")]
	public string Status { get; set; }
	[DataMember(Name="results")]
	public CResult[] Results { get; set; }

	[DataContract]
	public class CResult
	{
		[DataMember(Name="geometry")]
		public CGeometry Geometry { get; set; }

		[DataContract]
		public class CGeometry
		{
			[DataMember(Name="location")]
			public CLocation Location { get; set; }

			[DataContract]
			public class CLocation
			{
				[DataMember(Name="lat")]
				public double Lat { get; set; }
				[DataMember(Name = "lng")]
				public double Lng { get; set; }
			}
		}
	}
}

If you need to geocode a lot of addresses, you need to manage your request rate. Google will help you throttle requests by returning OVER_QUERY_LIMIT statuses if you are going too fast. I use the method below to manage this. It’s decidedly unelegant, please post a reply if you come up with something better.

private static int sleepinterval = 200;

private static GeoResponse CallWSCount(string address, int badtries)
{
	Thread.Sleep(sleepinterval);
	GeoResponse res;
	try
	{
		res = CallGeoWS(address);
	}
	catch (Exception e)
	{
		Console.WriteLine("Caught exception: " + e);
		res = null;
	}
	if (res == null || res.Status == "OVER_QUERY_LIMIT")
	{
		// we're hitting Google too fast, increase interval
		sleepinterval = Math.Min(sleepinterval + ++badtries * 1000, 60000);

		Console.WriteLine("Interval:" + sleepinterval + "                           \r");
		return CallWSCount(address, badtries);
	}
	else
	{
		// no throttling, go a little bit faster
		if (sleepinterval > 10000)
			sleepinterval = 200;
		else
			sleepinterval = Math.Max(sleepinterval / 2, 50);

		Console.WriteLine("Interval:" + sleepinterval);
		return res;
	}
}

Techniques for unique, correct and fast geo-queries II

You may remember my last post on this topic ended with a question. Just to recap, we have a table with a lot of rows that have geographical coordinates and we want to find a random subset that lies in a given map window. The problem with the query demonstrated last was that there are rows with the exact same coordinates and for those coordinates the query would always return the same row (namely the one with the highest intid).

I posted a question on Stackoverflow and Tom H. came up with a solution that was 90% there. The full query looks like this:

with cte as
(
    select
        intid,
        row_number() over
            (
                    partition by geoLat, geoLng
                    order by newid()
            ) as row_num,
        count(intid) over (partition by geoLat, geoLng) as TotalCount
    from
        documents d
	where
		d.geoLat < @maxLat
			and d.geoLat > @minLat
			and
			(
				((@maxLng > @minLng) and
					(d.geoLng < @maxLng and d.geoLng > @minLng))
				or
				((@maxLng < @minLng) and
					((d.geoLng > @minLng and d.geoLng < 180)
						or (d.geoLng > -180 and d.geoLng < @maxLng))
					)
			)
)
select top (@maxcount)
    dd.*, cte.intid, rand(cte.intid)
from
    cte,documents dd
where
    row_num = 1 + floor(rand() * TotalCount) and cte.intid = dd.intid
order by newid()

The query uses Common Table Expressions, which I’ve dabbled in before. Looking at the execution plan makes my head hurt, but it’s at least as fast as the original version. See the new version in action at the TEDBot site.

Showing maps and borders in Processing

A few days ago, I posted a video showing public procurement expanding geopraphically with the EU enlargements in the ’00s. There weren’t any borders, but you could sort of see the outline of Europe and how the dots spread east with time.

Adding actual borders to the map proved very frustrating. The Geographical Information System (GIS) space seems plagued by obtuse binary formats, stodgy desktop applications and a profusion of coordinate systems. I tried many avenues, one of the more promising being a smoothed map from MapShaper passed through TatukGIS and exported to KML. The coordinates from MapShaper turned out to be incompatible with the latitude/longitude ones I had from the Google Maps web services however.

After much searching, I found a KML-file in the Google Maps group (worldcountriesKML.zip) with the borders of all the worlds countries. It’s not smoothed in any way, so the haggard coastline of a country like Norway looks too thick when zoomed out. The result is better than the original though:

I implemented a simple Processing helper-class to parse and draw the KML. You instantiate it like this: helper = new XMLHelper(new XMLElement(this, "world.kml"));. It has a Init() method that takes a String[] of the countries you need and String denoting the XML path to the line coordinates, e.g. "Polygon/outerBoundaryIs/LinearRing/coordinates". After initialization you can ask it for its maximum and minimum coordinates using min_x, max_x, min_y, max_y. The Draw() method draws the map on the sceen, scaled to fit the size.

class XMLHelper
{
  float coordscale = 1;
  XMLElement borders;
  Line[] lines = new Line[0];
  public float max_y =0, min_y = 70, max_x = 0, min_x = 0;
  
  public XMLHelper(XMLElement xe)
  {
    borders = xe;
  }
  
  public void Init(String[] wantedcountries, String coordpath)
  {
    XMLElement[] filecountries = borders.getChildren("Folder/Placemark");
    for(int i = 0; i < filecountries.length; i++)
    {
      XMLElement c = filecountries[i];

      if(Util.Contains(wantedcountries, c.getChild(0).getContent()))
      {
        // this one should be included on the map
        String points = c.getChild(coordpath).getContent();
      
        String[] point_a = split(points," ");
        Point[] pointarray = new Point[point_a.length];
        for(int j = 0; j < point_a.length; j++)
        {
          String[] xyz = split(point_a[j],',');
          
          float x = float(xyz[0])/coordscale;
          float y = float(xyz[1])/coordscale;
  
          pointarray[j] = new Point(x, y);
  
          max_x = max(x, max_x);
          min_x = min(x, min_x);
          max_y = max(y, max_y);
          min_y = min(y, min_y);
        }
        // this looks slow
        lines = (Line[]) append(lines,new Line(pointarray));
      }
    }
  }
  
  public void Draw()
  {
    for(int i = 0; i < lines.length; i++)
    {
      Line l = lines[i];
      beginShape();
      for(int j = 0; j < l.points.length; j++)
      {
        vertex(
          map(l.points[j].x, min_x, max_x, 0, width),
          height - map(l.points[j].y, min_y, max_y, 0, height)
        );
      }
      endShape();
    }
  }
}

class Point
{
  public float x,y;
  public Point(float _x, float _y)
  {
    x = _x;
    y = _y;
  }
}

class Line
{
  Point[] points;
  public Line(Point[] _points)
  {
    points = _points;
  }
}

static class Util
{
  static boolean Contains(String[] a, String s)
  {
    for(int i = 0; i < a.length; i++)
    {
      if(a[i].toLowerCase().equals(s.toLowerCase()))
      {
        return true;
      }
    }
    return false;
  }
}

Video of procuring authorities in the EU

I did a video showing the geographical spread over time of authorities buying stuff through the EU public procurement system. We managed to hijack all the contracts some time ago and the addresses of the authorities and the winning contractors have now all been geocoded. You can also explore the data on the TEDBot website.

The animation starts in january 2003 and ends at the end of 2007. You can actually see the EU expansion happening in May 2004 with dots spreading east. 10 14 day intervals are shown each second. The animation was generated with Processing.

Techniques for unique, correct and fast geo-queries

UPDATE: Better solution here.

Here’s the scenario: You have a lot (a million+) of geotagged addresses in a database and you want to show them as markers on Google Maps. Some further requirements are:

  • You only want to show some constant (10) amount at any given time, since too many markers clutters the map and kills the browser
  • You want the markers shown for a given frame to be selected randomly so that a user looking at some particular area with many geocoded addresses is not always shown the same 10 markers
  • You want the markers not to be on top of each other, so that even though many addresses in the database have the same coordinates (i.e. “Copenhagen, Denmark”), you only return one result per coordinate (this is to avoid placing two or more markers in the same spot)
  • You want it to run at interactive speed on a crummy box

Imagine you have a Documents table with columns including geoLng, geoLat representing geographical coordinates and intid, a unique integer identifier. @maxcount is the maximum number of rows desired while @maxLat, @minLat, @maxLng and @minLng define the corners of the map viewport. This query will do the job:

select *
from Documents dd
where dd.intid in
(
    select top (@maxcount) max(intid)
    from Documents d
    where d.geoLat < @maxLat
        and d.geoLat > @minLat
        and
        (
            ((@maxLng > @minLng) and (d.geoLng < @maxLng and d.geoLng > @minLng))
            or
            ((@maxLng < @minLng) and
            (
                (d.geoLng > @minLng and d.geoLng < 180) or
                (d.geoLng > -180 and d.geoLng < @maxLng))
            )
        )
    group by d.geoLng, d.geoLat
    order by newid()
)

“What’s this monkeying around with the longitudes?” I hear your cry? Well, if the map viewport straddles the International Dateline (which is somewhere in the Pacific), Google Maps will feed you viewport corners that “wrap around” and that has to be handled. If-elses in SQL is a mess, so it’s better to cook up some pure boolean voodoo like above. “Who the hell looks at Google Maps of the International Dateline?” you ask. Good point, but it’s actually not that uncommon. Looking at Japan at low zoom-levels will often provoke this behaviour, as will looking at French Polynesia. Note that this trick is not needed for latitudes because the maps don’t wrap vertically

The slowest bit will usually be the order by newid() part, which gives each row in the prospective result a new (random) guid, and then sorts all the rows based on this column. It can be replaced with tablesample calls which are much faster, but also a lot more erratic.

There’s a very slight problem with this query in that the max(intid) will always cause the same row to be returned for any given Lat/Lng coordinate. The use of max(intid) is completely arbitrary and min(intid) would work too. Had there been a rand(intid) aggregate, the problem would have been solved. I haven’t figured out an elegant solution to this problem yet. Note that max()doesn’t work on guids produced by newid().

To get this to perform, the tables in question are organised around a clustered (geoLat, geoLng, intid) index. You can see somewhat more elaborate versions of this query doing their thing at the TEDBot website.